A 65 m borehole for 1.5 ha
of market gardening in Haute-Saône
A market garden business wants to irrigate 1.5 hectares from its borehole, with a storage tank and a generator as backup. Here is how this solar irrigation project is built in LE LAB, the solar pumping sizing application, with real screenshots and figures.
The need, as the client expresses it
Market gardening and a small orchard on 1.5 ha, very free-draining soil, up to 30 mm of water per week in summer. Irrigation is done by plot blocks, with intermediate storage: water from the borehole fills a tank, and distribution is then handled separately.
Additional constraint: the photovoltaic array will be installed on the corrugated steel roof of a farm building, south-facing, tilted at around 10°. The client wants a sizing that accounts for this pitch and avoids oversizing.
The input data in LE LAB
A few minutes of input. The solar reference city is Dijon, around sixty kilometres from the site. The need entered is the targeted solar share, 40 m³/day, and the seasonality is declared: pumping runs from April to October, and the study is aligned with this window. The generator will make up the difference toward the total target. The total head is calculated automatically: 62 m, including the delivery to the tank and the pipe head losses.
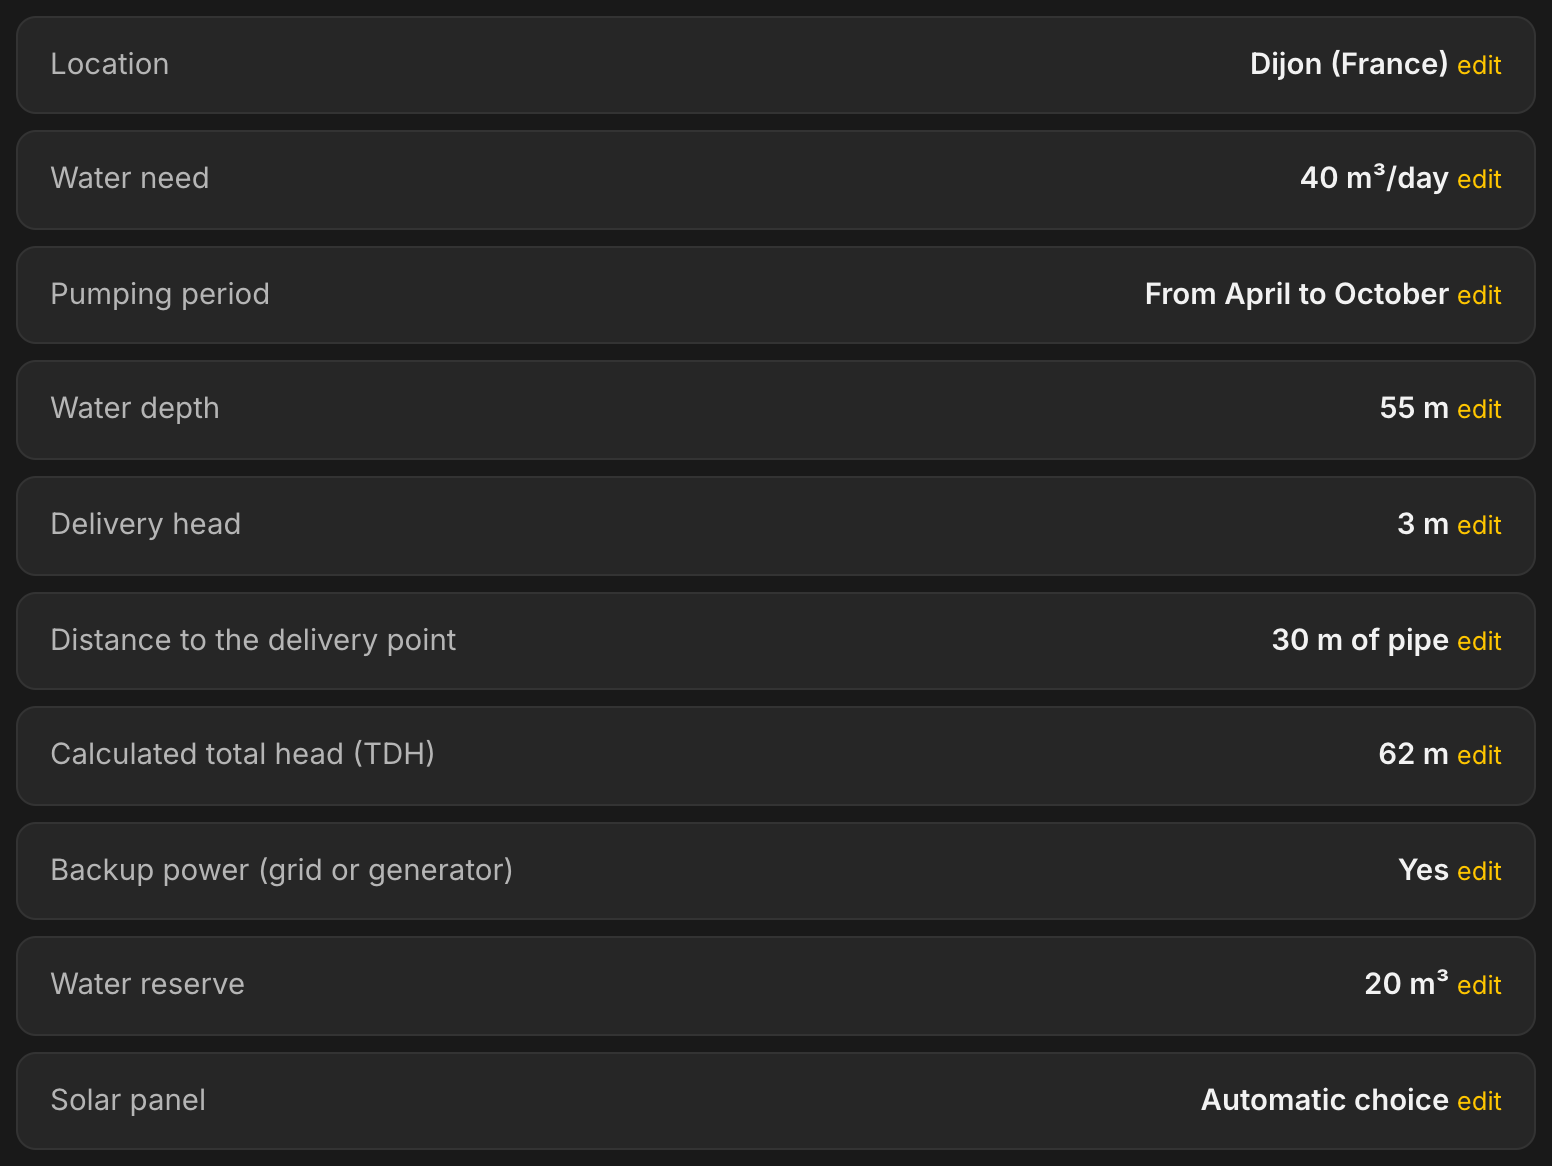
The summary before calculation: nine answers are enough, the total dynamic head is calculated for you.
What LE LAB proposes
Sized for the irrigation season rather than the full year, the system stays modest: a LORENTZ PS2-1800 with the C-SJ5-12 end, powered by 6 panels of 450 Wp, for 2,700 Wp across two strings of three. Average production over the season: 40 m³ per day, up to 55.5 m³ at the height of summer. The same project sized for the full year would have required twice the panels and a larger controller: seasonality is the first answer to the client's request to avoid oversizing.
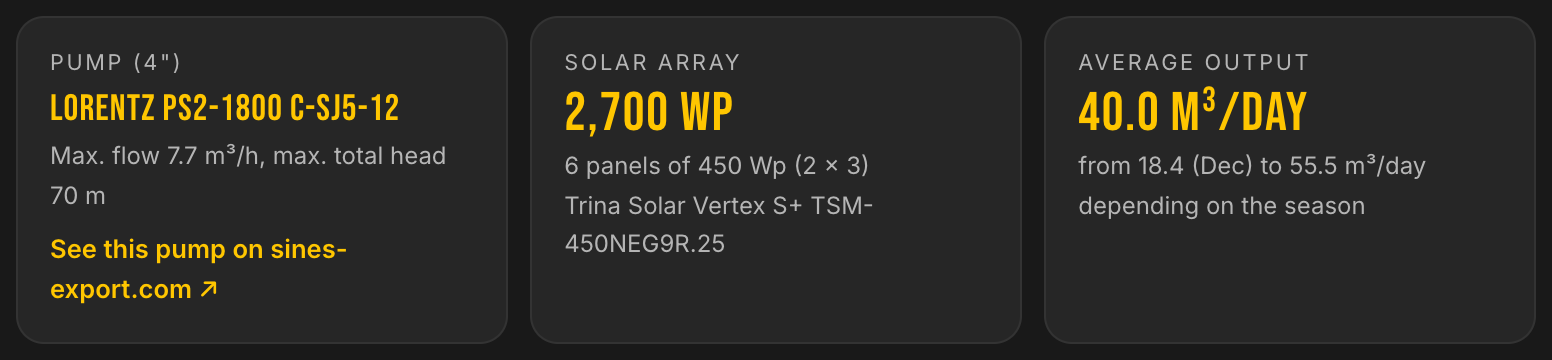
The solution at a glance: pump, solar array and average production.
The 10° roof: the constraint, quantified
The array will sit on a roof tilted at around 10°, far from the region's optimal 37°. Rather than a debate, an answer: LE LAB's angle setting recalculates the whole study at the actual angle.
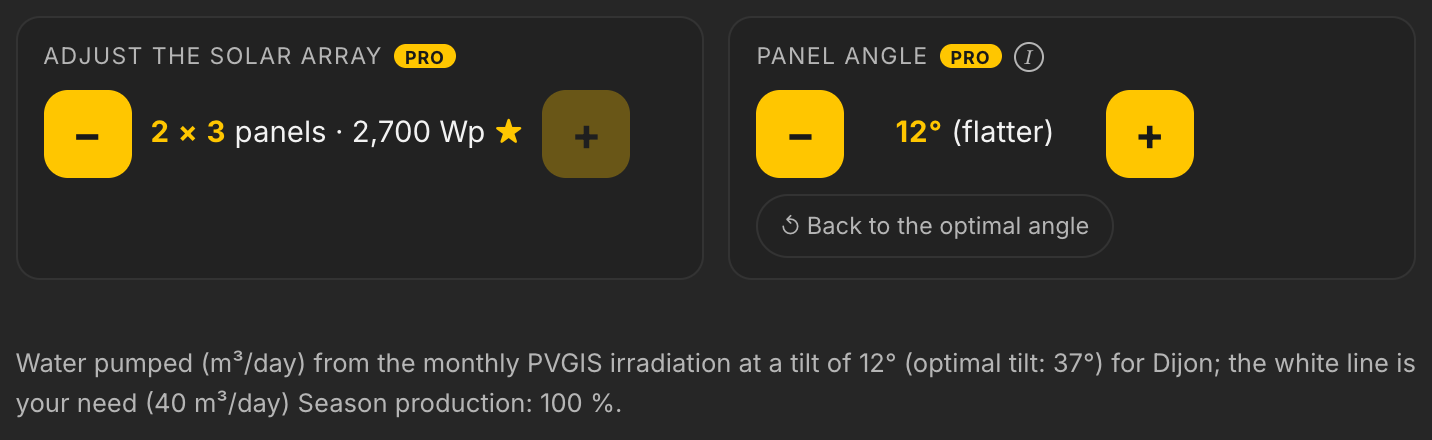
At 12°, season production stays at 100% of the optimum: over the April-to-October window, the roof costs nothing, because the flat angle favours summer precisely.
Production, month by month and hour by hour
Monthly production is read against the need, over sixteen years of the region's real solar data. Daily output shows the typical day for each month: in summer, the pump holds its plateau around 5 m³/h during the hours of full sun.
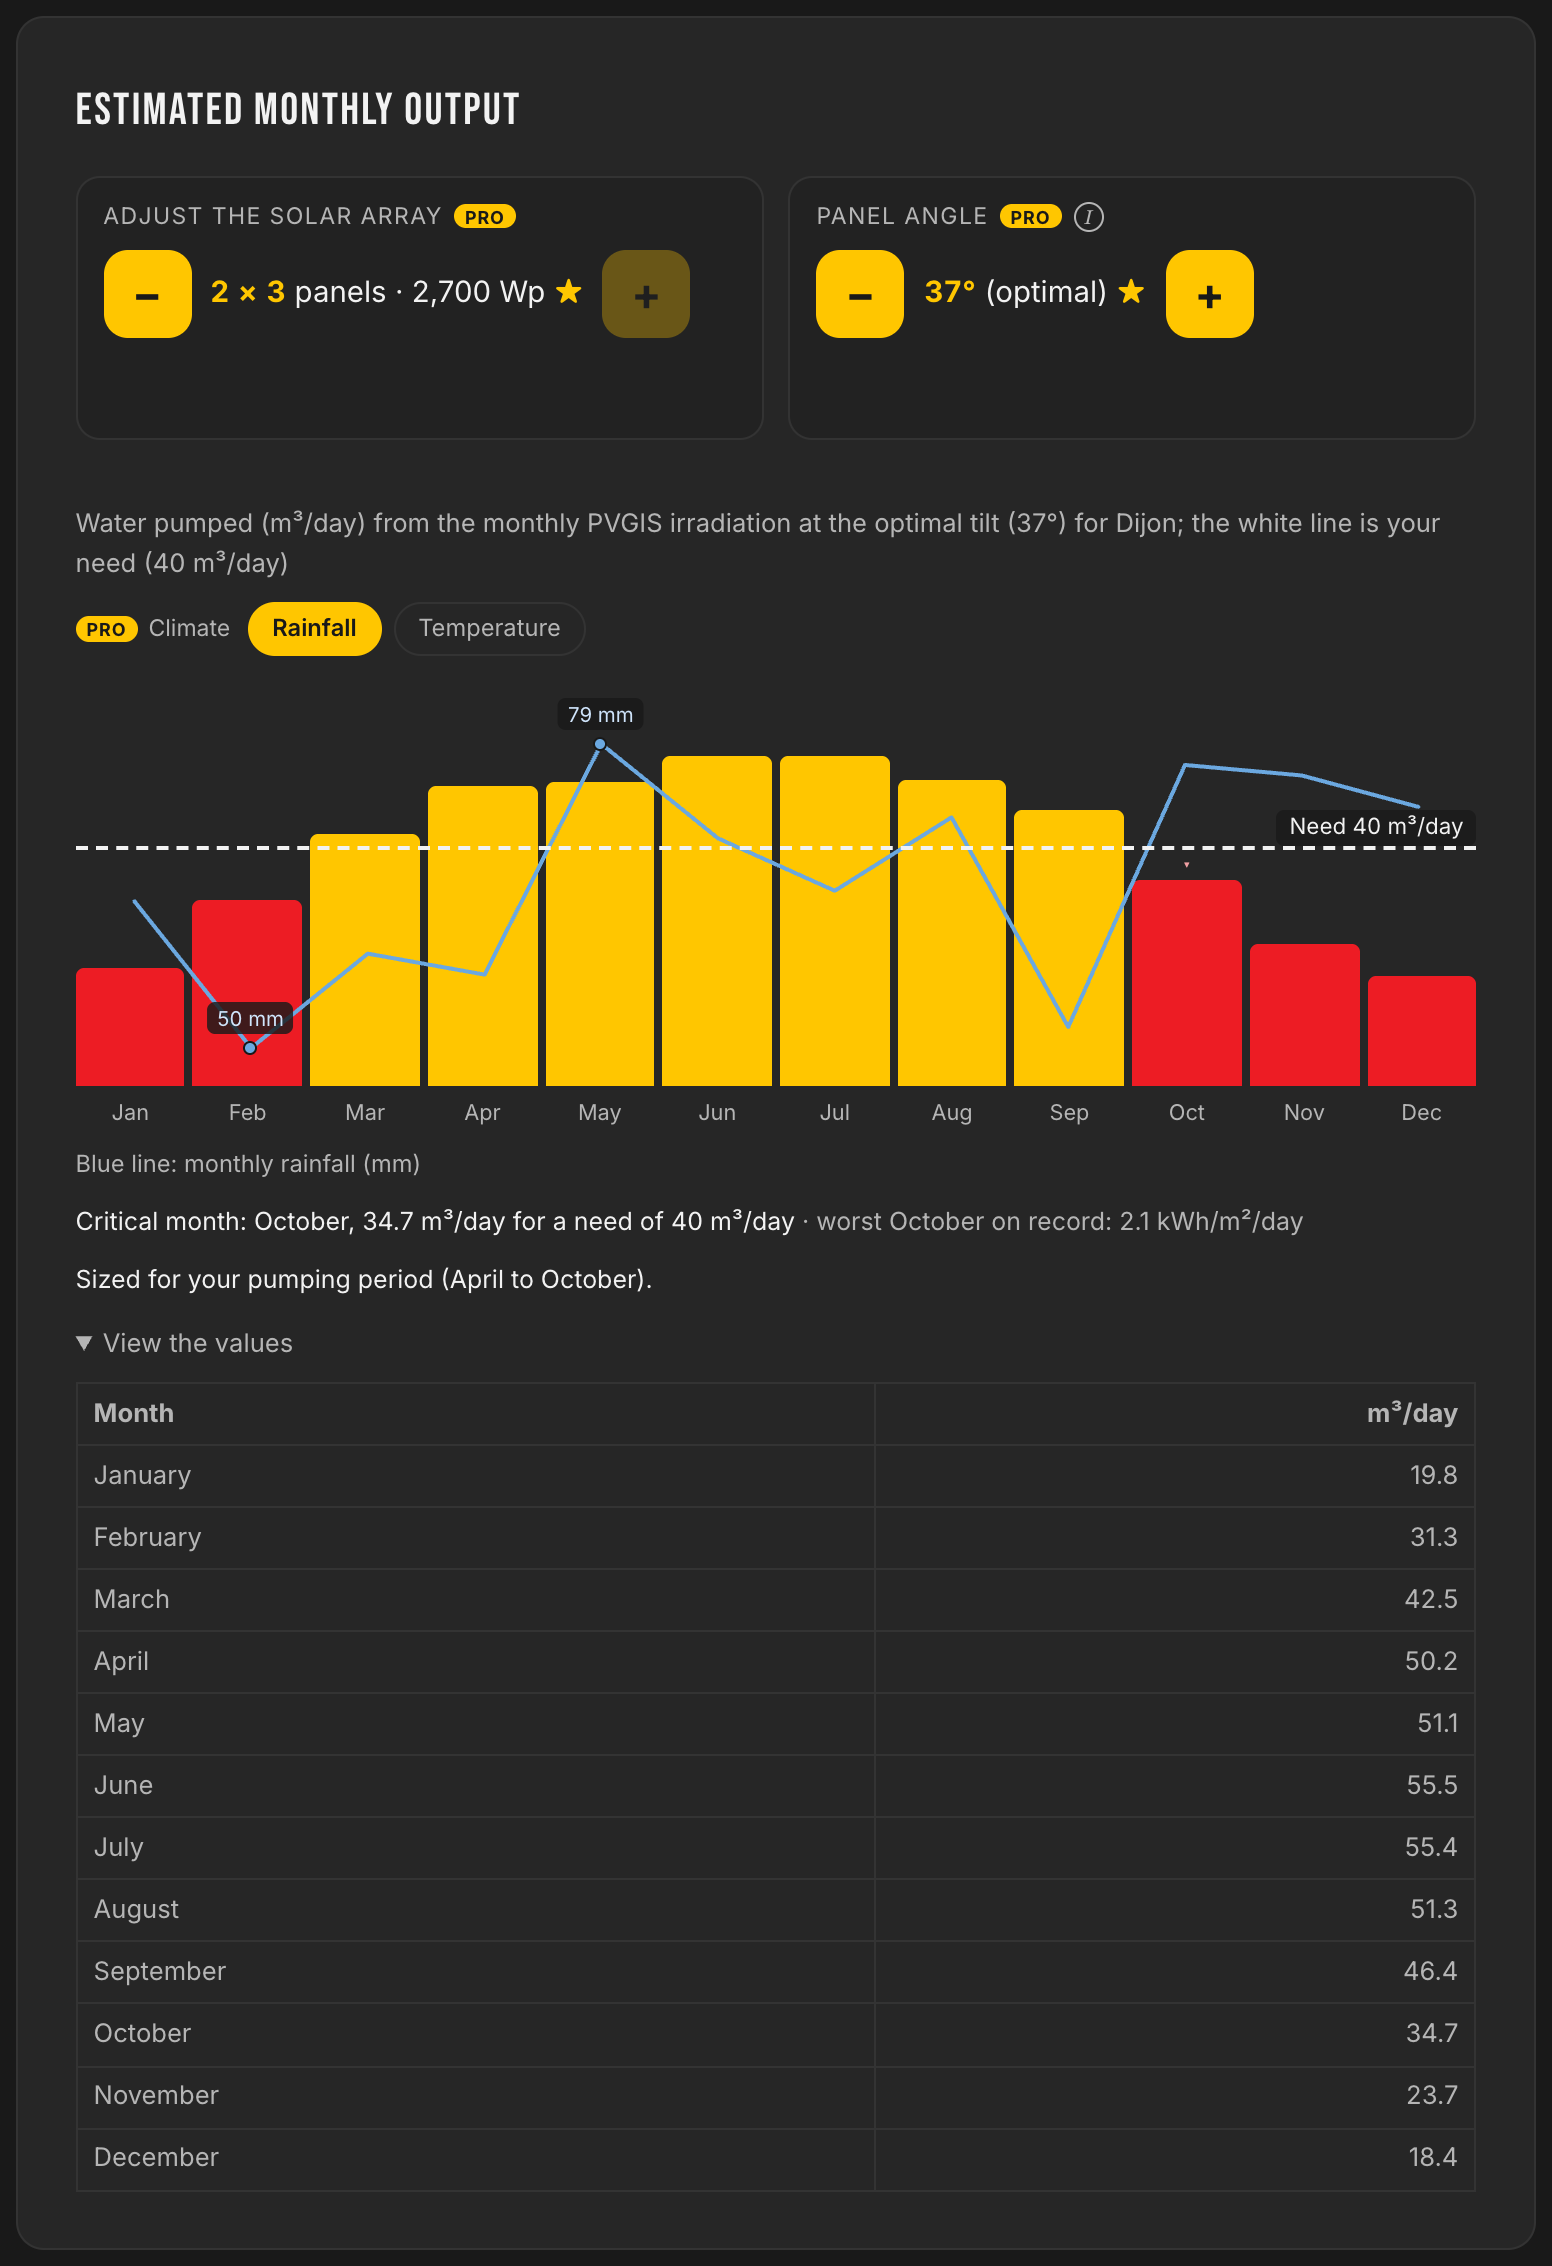
The study is sized for the pumping period: the reference month is the worst of the window, not an irrelevant winter month.
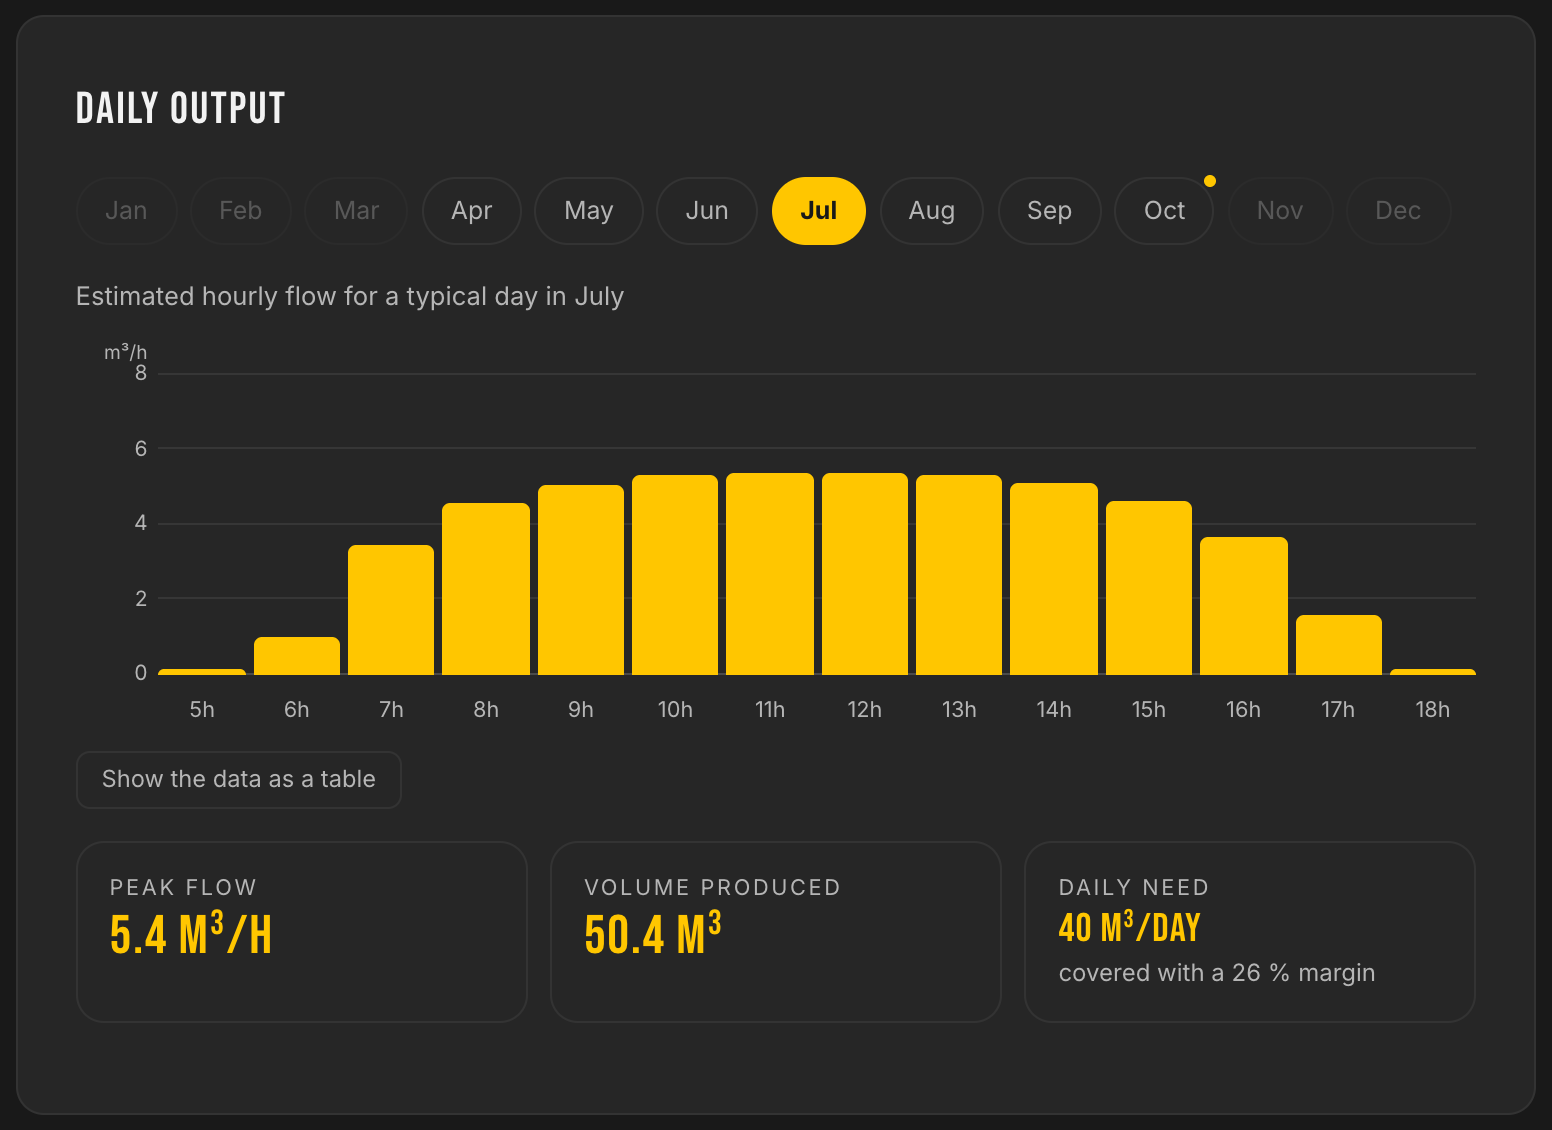
The typical July day, hour by hour: enough to schedule irrigation rotations by block.
The 20 m³ tank put to the test
LE LAB simulates the water reserve day by day over sixteen years of real weather, over the declared season and with the tank full each spring. The verdict is nuanced, and that is its value: 168 of the 214 season days are fully covered with the 20 m³ tank; the 46 incomplete days are concentrated at the shoulder seasons, and on those days the system still delivers 65% of the need on average.
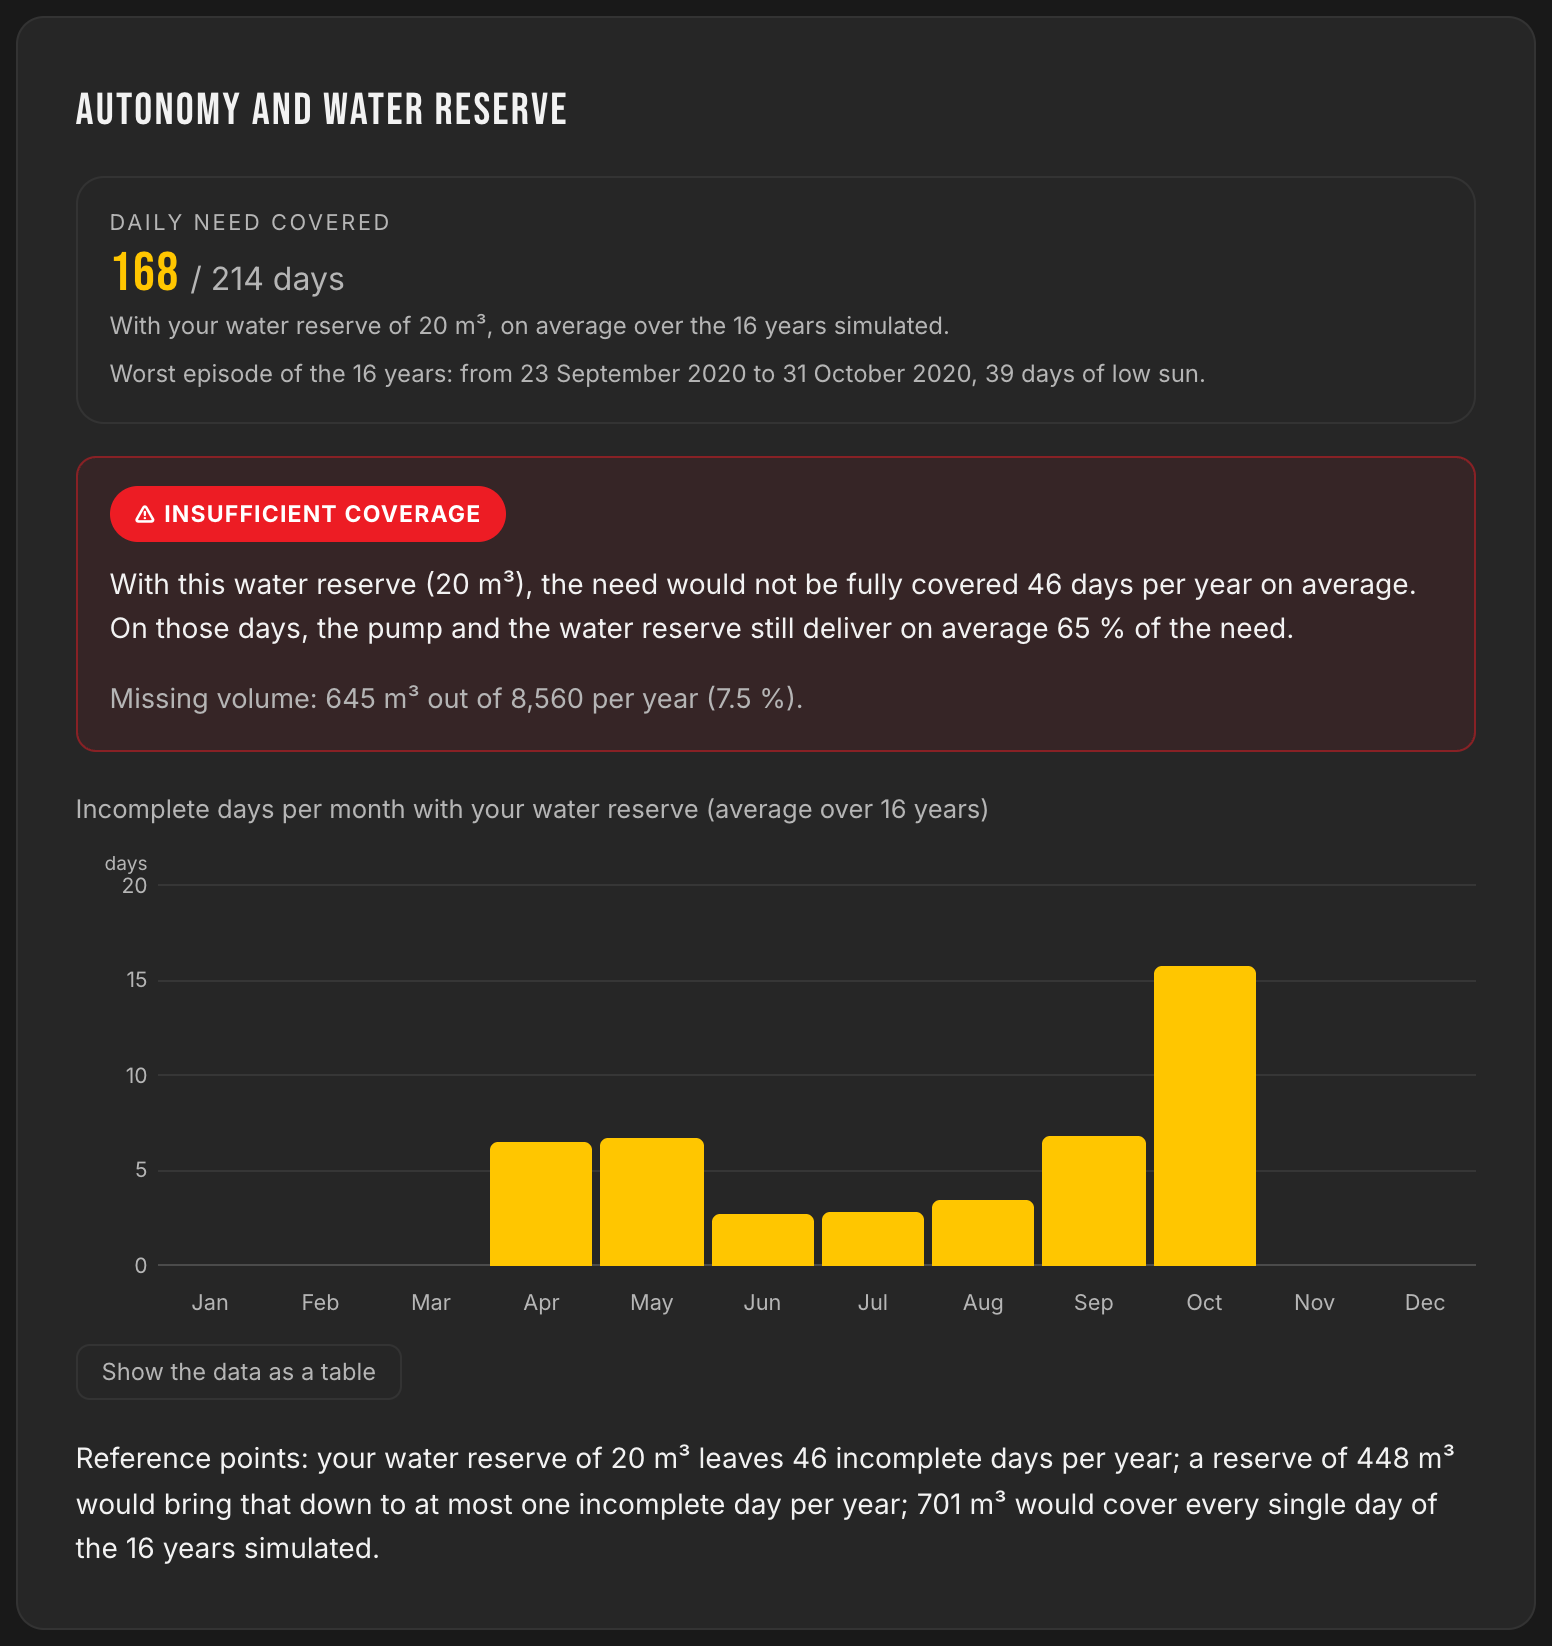
The planned expansion to 80 or 100 m³ will absorb a good share of the short shoulder-season episodes. And the figure that justifies the generator: covering every day of the season with the tank alone would require 701 m³. Backup power is the economic obvious choice.
Manufacturer curves, at the real operating point
The client asked for the Q/H curves at the real operating point: here they are, plotted from official LORENTZ data, with the project's head highlighted.
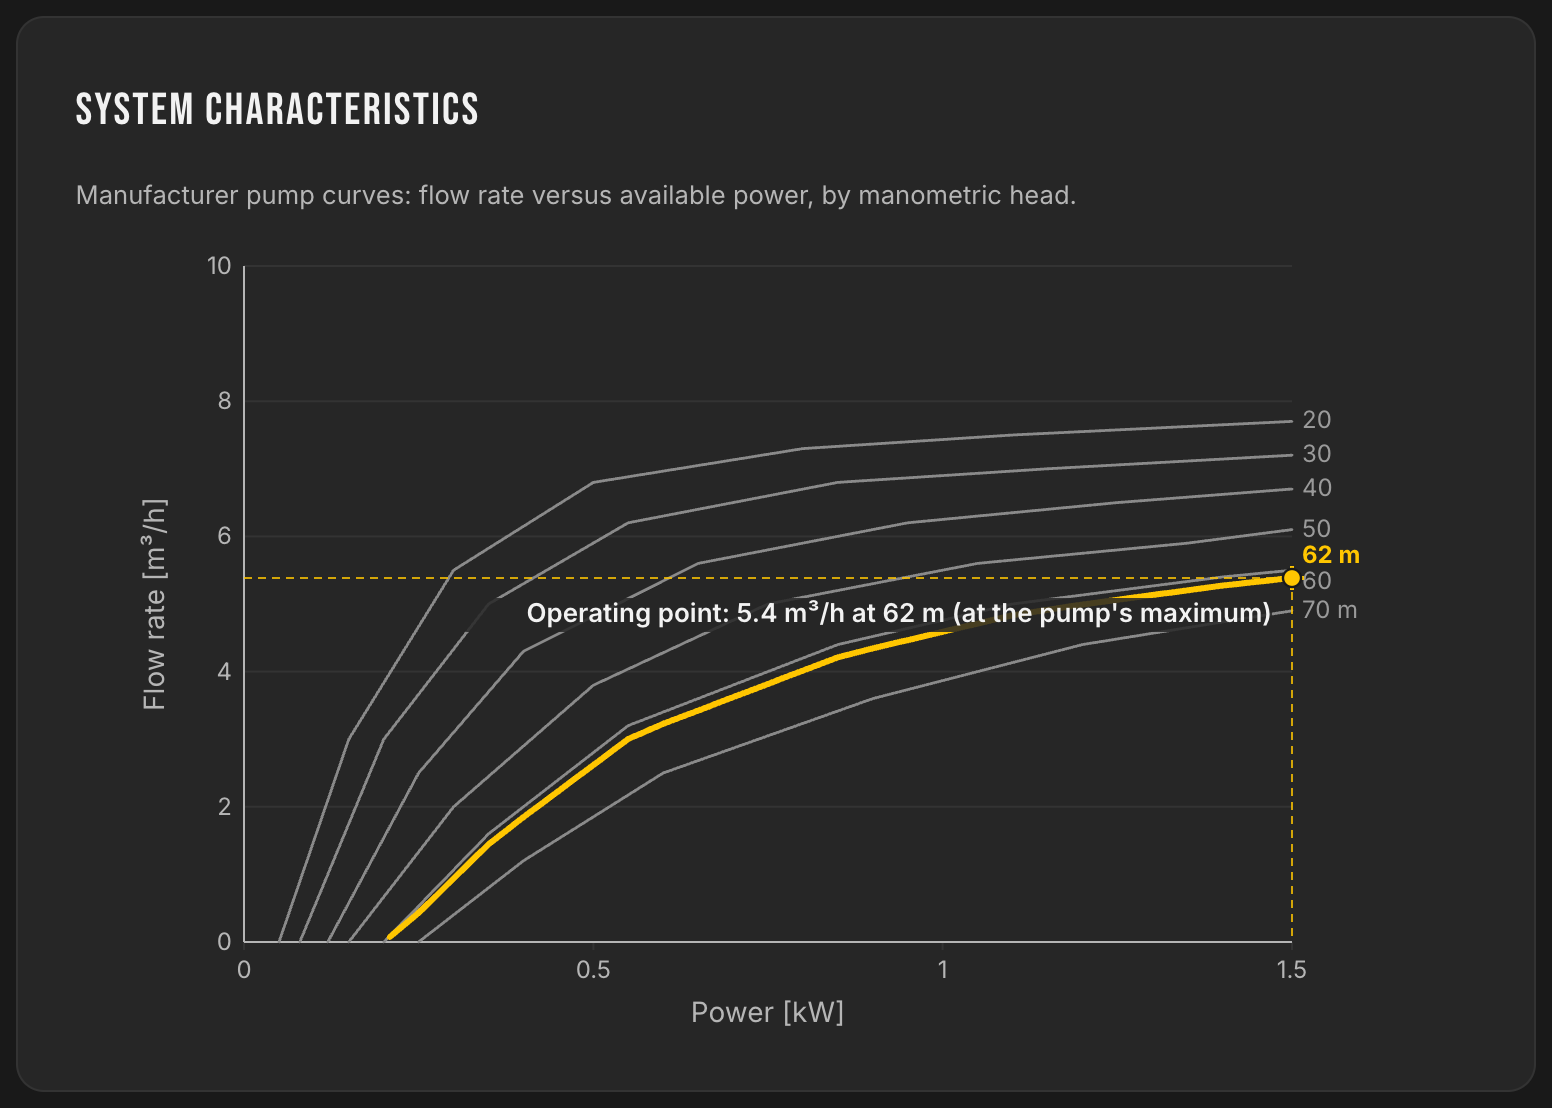
Flow according to available power, by head. The yellow curve is the project's, at 62 m.
The tool frames, the trade decides
Your project deserves the same study
Replay this study with your own figures: location, need, borehole. Free, no registration, results in a few minutes.